Asking Beat Knowing: Six Weeks Rebuilding My Homelab with Claude
How I went from zero Docker to 14 containers, a 33-tool MCP server, and a Grafana log pipeline in six weeks, by asking better questions.

Six weeks ago Docker wasn't even installed on my server. Today that same machine runs 14 containers, a custom MCP server with 33 tools, and a log pipeline pulling in over 800,000 events a day. I didn't take a course. I didn't follow a tutorial. I asked an AI questions, and I got better at asking them.
I've spent 25+ years in IT, so let me be clear about what this post is and isn't. It isn't "AI replaced my skills." It's the opposite. The skills are what made the AI useful. But the mix of the two built things in six weeks that I'd been putting off for years.
Here's the running math, and then the stories behind it.
The build, by the numbers
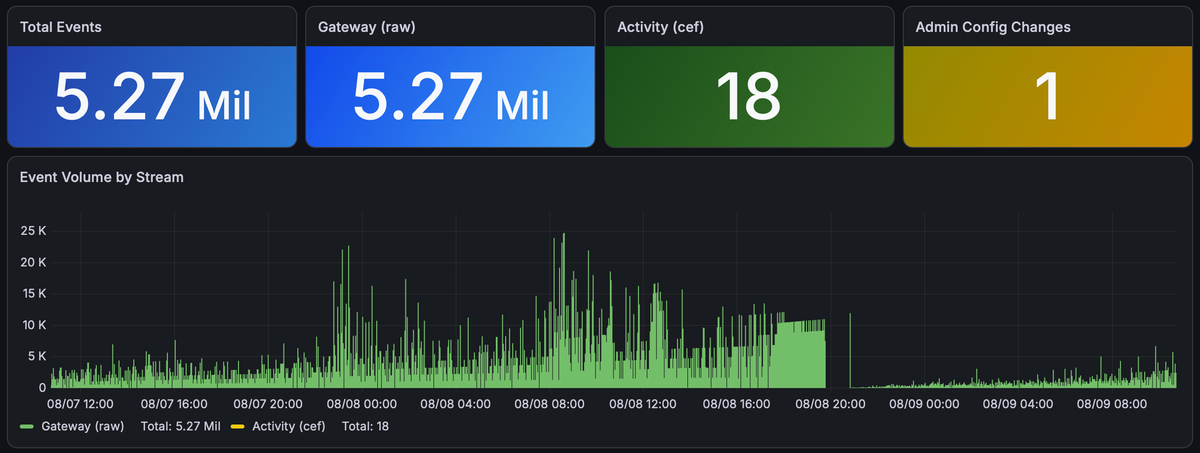
Containers went 0 to 5 to 14 over about four weeks. The MCP server started at 5 tools and sits at 33. The log pipeline is five days old and already holds 13 GB of archived events, with 842,000 landing in a single day. A Grafana query that took 4.5 seconds now takes 2 milliseconds after a caching pass we validated against the docs first. None of these numbers are estimates. I pulled them live before writing this.
The MCP server, or how I stopped needing a laptop
The whole thing started with a lazy question. Could I work on my homelab from the couch, or from my phone, without SSH-ing in from a laptop?
Two paths were on the table. The easy one depended on a terminal session staying alive on the server. The harder one was building a custom remote MCP server, self-contained and always on. I picked the harder one on purpose, and it's the reason everything still works today from a phone while every machine in the house is asleep.
One gotcha shaped the entire architecture. Claude connects to a custom connector from Anthropic's cloud, not from your device. So the server has to be publicly reachable, which killed the obvious VPN-only approach. The answer was a Cloudflare Tunnel. Outbound only, no inbound ports opened, no new firewall rules.
Now I can ask my infrastructure a plain-English question and get a real answer off live systems. Network health, container status, storage, VPN, certificates, all in one pull instead of five consoles. It can take action too, like adding media or clearing a stuck download queue. In an office, shoulder taps are how work gets interrupted. Here, the shoulder tap is the workflow. I tap, it answers, nobody's day gets wrecked.
My favorite piece is the scheduled daily brief. It runs unattended in the cloud at 6am while my laptop sleeps. Which means the brief arriving at all is itself proof that the tunnel, the server, and the gateway are alive. A free heartbeat, designed around the agent's execution context instead of mine.
The 14-hour outage that looked like DNS
Then I got burned, and it's the best thing that happened to the project.
One evening IPv4 died. Exactly 4 hours and 16 minutes after my gateway's software auto-upgraded, which turned out to be the first DHCP lease renewal after the update. The vendor's cloud alert didn't reach my phone until 3.5 hours after the actual failure. Total time dark, about 14 hours.
Why was it gnarly? Four layers of misdirection. IPv6 stayed up the whole time, so remote access kept working while the internet was dead, which looks exactly like a DNS problem. The gateway's own health API reported 100% WAN availability during a total outage. The failure had two causes, an ISP subnet renumber plus a DHCP client that refused to re-discover, and neither was sufficient alone. And the obvious fix, editing the WAN config and re-provisioning, did nothing, because only a cold boot forces the DHCP discovery this situation needed.
How did it crack? Not by trusting any status indicator. By comparing before-and-after values. Once I put the old WAN address next to the new one, an entirely different subnet stared back and the whole mystery collapsed. A renumber and an outage look identical from inside the device. They look nothing alike side by side.
Building the pipeline that turned the tide
The very next day I asked Claude to help me build a syslog pipeline, for one reason. The gateway was the thing that failed, so the gateway was the worst possible place for the evidence to live.
I've always been infrastructure minded. That's the sys admin in me. But I know exactly what standing up a logging stack used to cost. A few days of trial and error, combing the web for what might work, trying to decipher which tool I could actually run with. And even after all that, I could still land on the wrong one. This time I asked questions instead. Claude compared the options against my actual setup, we picked a path in one conversation, and the whole stack was live the same day. Zero to hero in hours, not days or weeks. That alone paid for the effort of learning to work this way.
The stack is Vector into Loki into Grafana, running in Docker, about 320 MB total. We evaluated Logstash and rejected it at roughly 2 GB of overhead for this volume. Events land in two places, a durable file archive and the query layer, so if the query layer has a bad day the evidence still exists.
The details are where the experience paid off. The archive files use an .ndjson extension because my backup client silently excludes .log and .txt files by default, which we verified by reading the actual exclusion config instead of assuming. The collector runs in Docker instead of as a native agent because macOS blocks inbound UDP listeners for agents but Docker already holds the permission. Both of those were caught in research before the build, not debugging after.
And the pipeline earned its keep within hours. It surfaced rogue IPv6 router advertisements on the WAN segment from two devices I'd never have seen otherwise. Almost certainly benign ISP infrastructure, but completely invisible before.
The best bug of the whole project lived here too. Files were filling, the dashboard was empty, and nothing anywhere reported an error. The gateway sends syslog in local time with no timezone, the collector read it as UTC, and the log store silently rejected every event as arriving 7 hours out of order. Nothing was on fire, nothing was alerting, and it was completely broken. That category of bug is exactly why "all green" on a dashboard means less than people think. For the record, 13 of my 14 containers report no health status at all, because the images don't define a healthcheck. Green often just means nobody's checking.
What Claude got wrong
Now the honest part, because I won't oversell this.
Claude was wrong plenty. It misread an SSH setting, and the correction led to finding open SSH ports on my switch and APs that I then closed. It claimed my media stack wasn't containerized when it was. It guessed wrong on why a gateway rebooted, and I found the real cause myself while it retracted and rewrote its explanation. There were more.
Here's the thing though. Every one of those errors arrived fast, in writing, in a form I could check. That's the actual value. Not an oracle that's always right, but a partner that's wrong out loud. AI doesn't take everything off your plate. It hands you a sharper plate and expects you to inspect what's on it. If your plan is to paste commands without reading them, this workflow will hurt you.
The most uncomfortable lesson? I correctly diagnosed a connector registration quirk early, wrote it down, and then repeated the same mistake across five separate sessions anyway. Knowing the fix and applying the fix are different skills. Very few people write that part down, so I am.
The questions that mattered
Every major save in this project came from a question, not from prior expertise.
Before letting Claude write my container migration, I said, verbatim, "before you do that, research the web and ensure my setup will work." That one sentence converted a plausible-looking config into a verified one and probably saved my media library. When I explained why I wanted containers, "I want these to be migration capable," instead of just what I wanted, every downstream decision settled itself. Requirements beat instructions.
The highest-leverage question was the least technical one. I asked for an honest ownership split, accuracy over flattery. Which decisions were genuinely mine, and which parts were AI-generated? The answer included an unflattering list, no version control on the server source, unresolved secrets hygiene, that repeated connector mistake. Asking a tool to critique your use of it is the move most people skip.
Where this goes
Twenty-five plus years of IT taught me to document everything, automate what repeats, and drive tickets toward zero. Turns out those instincts transfer straight into working with AI. The most valuable MCP work wasn't adding tools. It was encoding judgment into the tools, so known-benign alerts are filtered in code and a fresh conversation with no memory still doesn't cry wolf.
The goal was never to build a fancier lab. It was to empower somebody, in this case me, to self-serve before reaching for the old manual grind. Ask better questions and the answers get cheap.
So here's mine for you. What's the best question you've asked an AI lately?