Building a Multi-Station Weather Display on an E-Paper Panel
Built a multi-station weather display on an e-paper panel with Claude in about an hour, no real Arduino skills required.

tl;dr - Built a weather display on Inkplate hardware. Pulls live data from four stations. Made everything swappable by design. Rotated, resized, and debugged along the way.
The idea
I found the Inkplate 5V2 (w/enclosure + battery) while working on a Meshtastic project and ran across soldered.com, the company that makes it. The e-paper display caught my eye, so I asked Claude what I could build with one. I fed it a handful of ideas pulled from soldered.com's own product pages, and a weather display is where we landed. No backlight, no glare, low power draw. The kind of thing that just sits on a shelf and works.
The problem
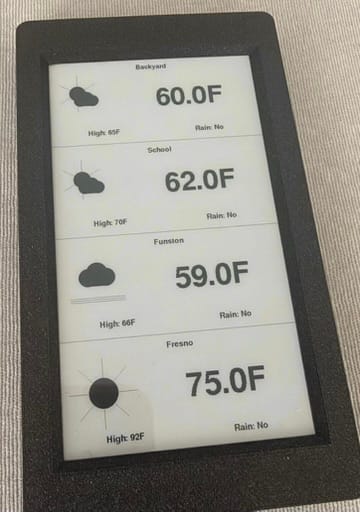
I check my backyard weather station a lot, just to get a feel for the kind of day it's shaping up to be. San Francisco has enough microclimates that one reading never tells the whole story. I wanted to see the weather near my kids' school too, so I know whether they need a raincoat, a sweater, or shorts that day. Same idea for a golf driving range I visit, and for my parents' place, where the temperature swings from San Francisco by a wide margin. One board, four locations, no more guessing before I walk out the door.
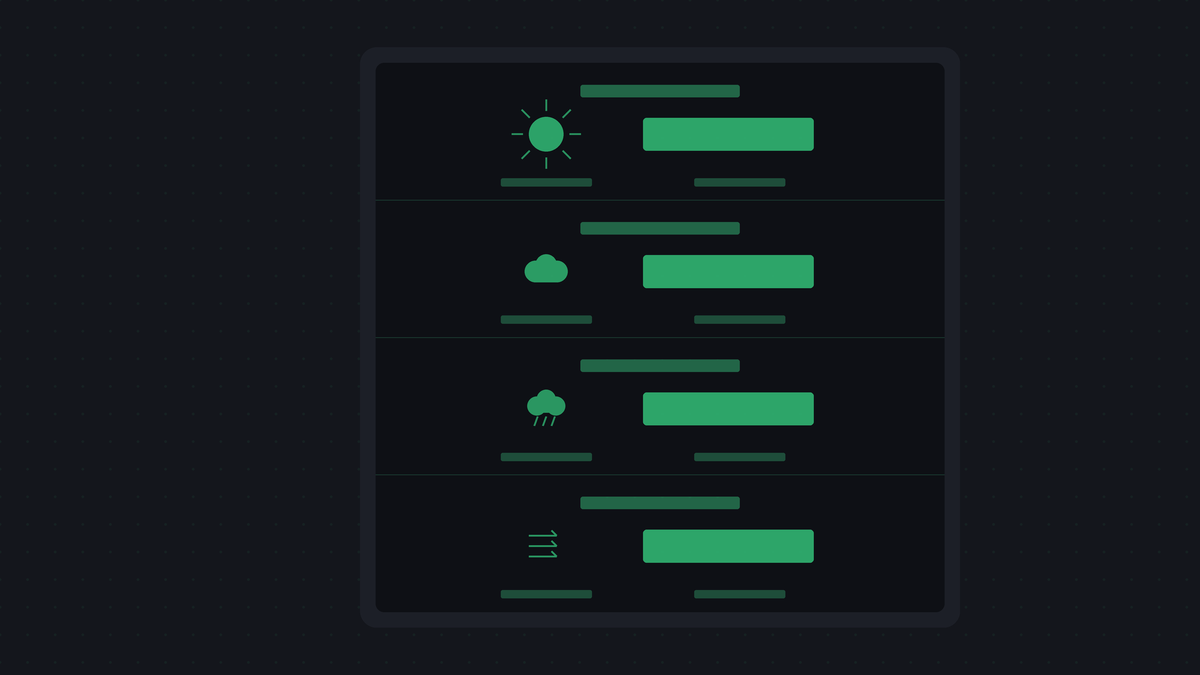
What I actually needed at each spot came down to four things: the current temperature, today's projected high, whether rain was likely, and a quick visual read, sunny, cloudy, rainy, so I could tell the weather at a glance without parsing numbers first thing in the morning.
Getting the basics working
My own backyard station already feeds Weather Underground, and WU pools in a huge network of other crowdsourced personal stations too, so most of the spots I cared about already had one nearby. Every station has its own ID, and one API key from Weather Underground gets you current conditions and a forecast for any of them. Once I had station IDs for each spot, I handed those to Claude and had it build against Weather Underground's API.
I'd messed with Arduino a long time ago, back around when it first came out, and I had zero intuition for where to start on something like this now. ESP32 boards, e-paper drivers, deep sleep cycles, none of it was familiar anymore. That's where Claude filled the gap, sketching out the structure while I set the requirements and caught what didn't fit.
The sketch runs on the ESP32, connects to WiFi, and makes two API calls per station. One for current conditions, one for the day's forecast, reusing the station's own coordinates so I didn't need a separate geocode lookup. Everything gets parsed with ArduinoJson and drawn straight to the panel with the Adafruit GFX drawing calls the Inkplate library wraps. The whole cycle runs once in setup(), then the board drops into deep sleep for ten minutes and wakes up to do it again. loop() never actually runs.
First real bug was a fun one. The display came up mirrored, and I spent a while assuming it was a rotation setting or a hardware defect. Turned out I had the wrong board selected in the IDE. Same physical hardware, two similar board profiles, only one of them matches. Once I picked the correct one, the mirroring vanished. Nothing to do with rotation at all.
From there, Claude walked me through the setup step by step as I fed it what I wanted the display to show. Most of the trial and error was on how the final result looked, layout, sizes, icon placement, more than on the code itself. About an hour after I started, I had exactly what I wanted running on the panel. The only real Arduino skill I needed was setting up the IDE and knowing which settings to toggle, board selection, library installs, that kind of thing.
Making it flexible
I wanted to swap stations or rotate the API key without touching the logic, so station IDs live in a simple array at the top of the file and the key is one constant. Add a station, bump a count, done. That decision paid off fast. I went from two stations to four in one pass with no changes anywhere else in the code.
Layout and readability
Font size started as an easy ask and turned into the more interesting problem. Bumping up text size with the built-in bitmap font just made things blockier, so I moved to vector fonts for smoother edges, with size and font family both broken out as swappable settings. Then came a real layout bug: once the temperature text got big enough, it started overlapping the row below it. The fix wasn't more guessing at pixel offsets, it was replacing that guesswork with real measurement. Every text block now gets centered inside its own fixed section using the font library's own bounding-box calculation, so a size change can never make two lines collide again.
Rotating the display 90 degrees and switching from a row layout to a stacked single column just meant changing a couple of constants. The grid math underneath was already built to handle either layout.
Adding weather icons
Last piece was a small icon next to the current temperature, sun, cloud, fog, rain, whatever the forecast says. The same forecast call already returns a numeric condition code, so no extra API call was needed, just a mapping table and a handful of vector shapes (circles, lines, a couple of triangles) drawn directly on the panel. No image files to manage or flash space to burn.
One wrinkle after flashing: a build error saying the icon's data type "does not name a type." Nothing wrong with the type itself, it was declared in the wrong place. The IDE auto-generates function prototypes and inserts them near the top of the file, ahead of any custom type declared further down. Moving the type definition up above every function using it cleared it immediately.
The bug that wasn't a bug
After that fix, one station started showing up without its icon and a "high: n/a" reading, then a different station did the same thing on the next refresh. That pattern, rotating between stations rather than sticking to one, ruled out a config problem. I added serial logging around every API call and field check so I could watch exactly what came back on each cycle. Turned out to be the weather API itself occasionally returning a null forecast field for whichever station it felt like that cycle. The code already falls back gracefully when that happens, and the next ten-minute refresh clears it. Nothing to fix, just something to confirm.
Easier than I expected
This turned out to be one of the easier projects I've taken on, despite starting from zero real Arduino skills. Feeding Claude what I wanted and reacting to what came back kept surfacing things I hadn't thought to ask for. The icon only happened because I was staring at a working display and realized a number alone wasn't telling me enough. That back and forth ended up solving a problem I didn't know I had until I saw it on the panel.
Links
- Inkplate 5V2 hardware and Arduino library (Soldered Electronics)
- WunderMap @ Weather Underground for local stations (WunderMap)